Debugging and Troubleshooting
You can debug and troubleshoot deployments in Omnistrate by leveraging the tools and features described below. These capabilities provide you with detailed visibility into each step of the deployment process, enabling you to identify, diagnose, and resolve issues efficiently.
Debugging Tools Overview
Omnistrate provides debugging tools to help you diagnose and resolve deployment issues:
| Tool | Purpose | When to use |
|---|---|---|
| Debug Events | View real-time workflow progress and errors | First step — identify which stage failed |
| Instance Debug | Inspect the instance's resource dependency graph, workflow events, resource logs, metrics access, and resource-specific artifacts | Default starting point for Helm, Terraform, Compose, and Operator troubleshooting |
Debug Events
Omnistrate's Debug Events feature provides real-time, detailed insights into your deployments, allowing you to quickly pinpoint and resolve issues by offering a transparent view of each operation's progress and status.
How Debug Events Works
For each instance operation—such as create, modify, upgrade, start, stop, or delete—Omnistrate launches a dedicated workflow to carry out the task. This workflow moves through several defined stages, including bootstrap, storage, network, compute, deployment, and monitoring. Within each stage, actions are tracked as individual debug events in chronological order, giving a precise view of each action's execution status. This structure enables you to monitor the workflow's progression step-by-step and quickly locate the root cause of any issues. 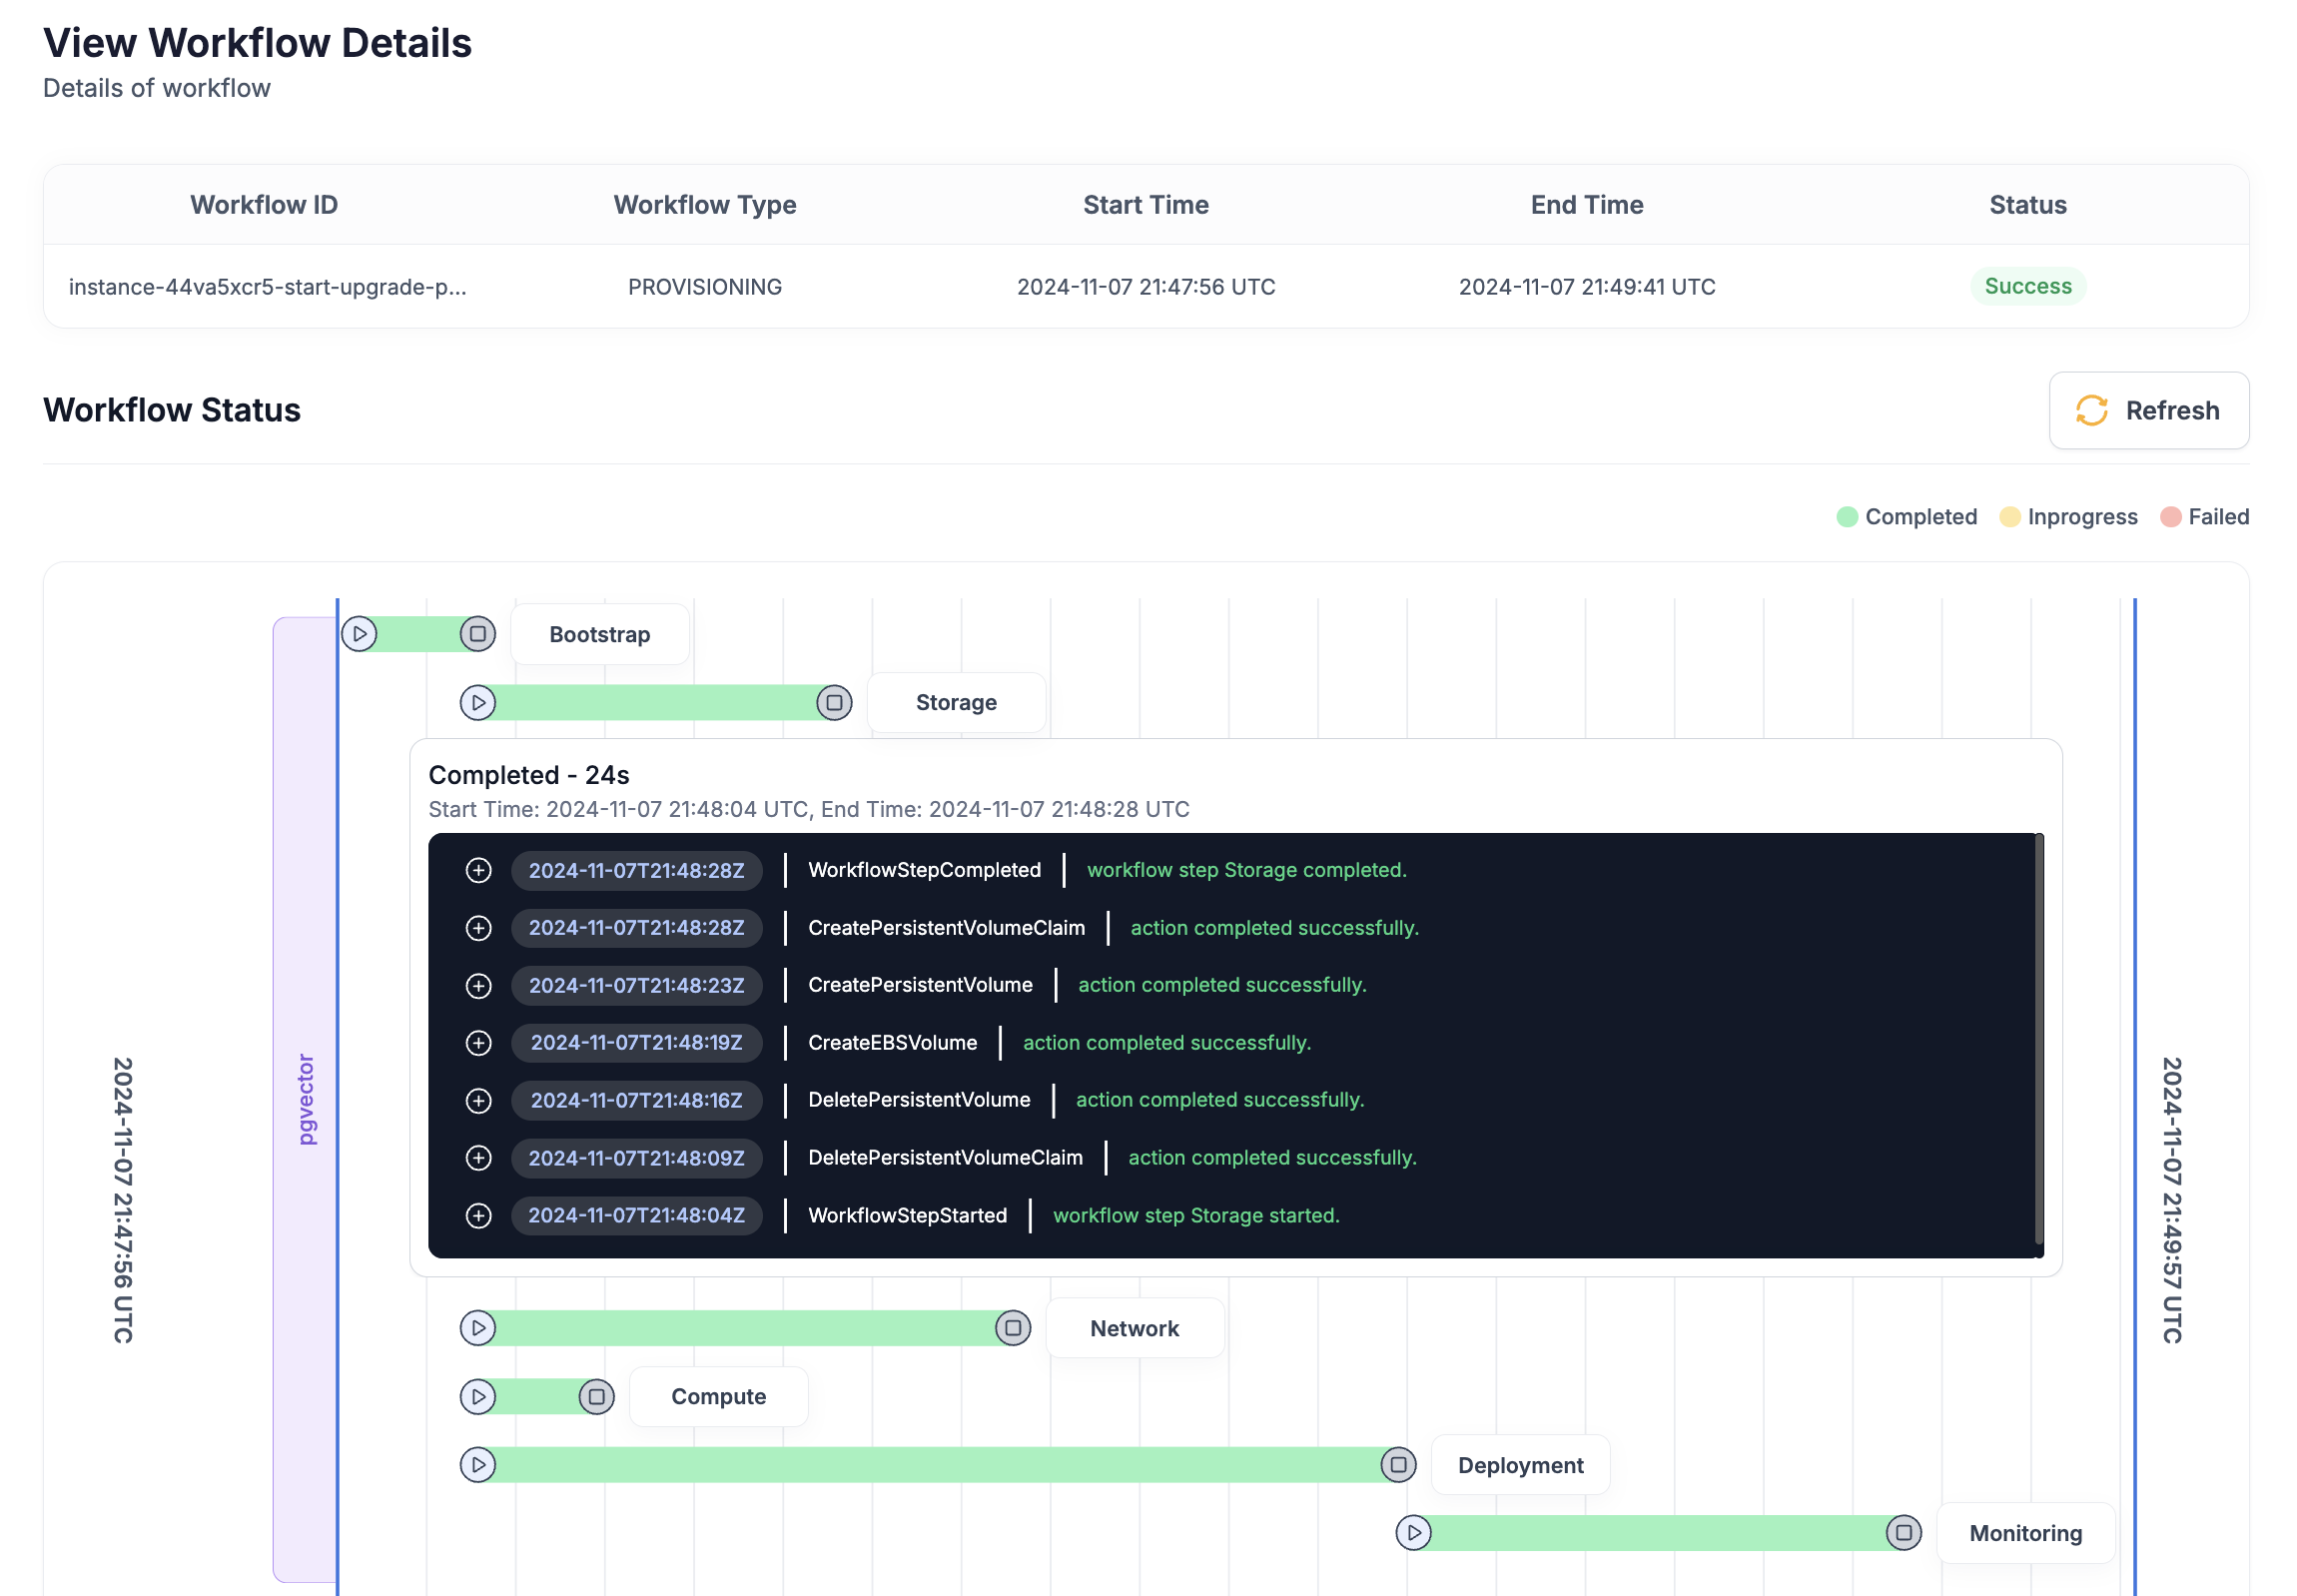
Debug Events Example Scenarios
When a workflow encounters an issue, such as an invalid instance type parameter, debug events identify the specific error within the workflow. This detailed view enables you to diagnose and resolve issues swiftly, ensuring minimal disruption.
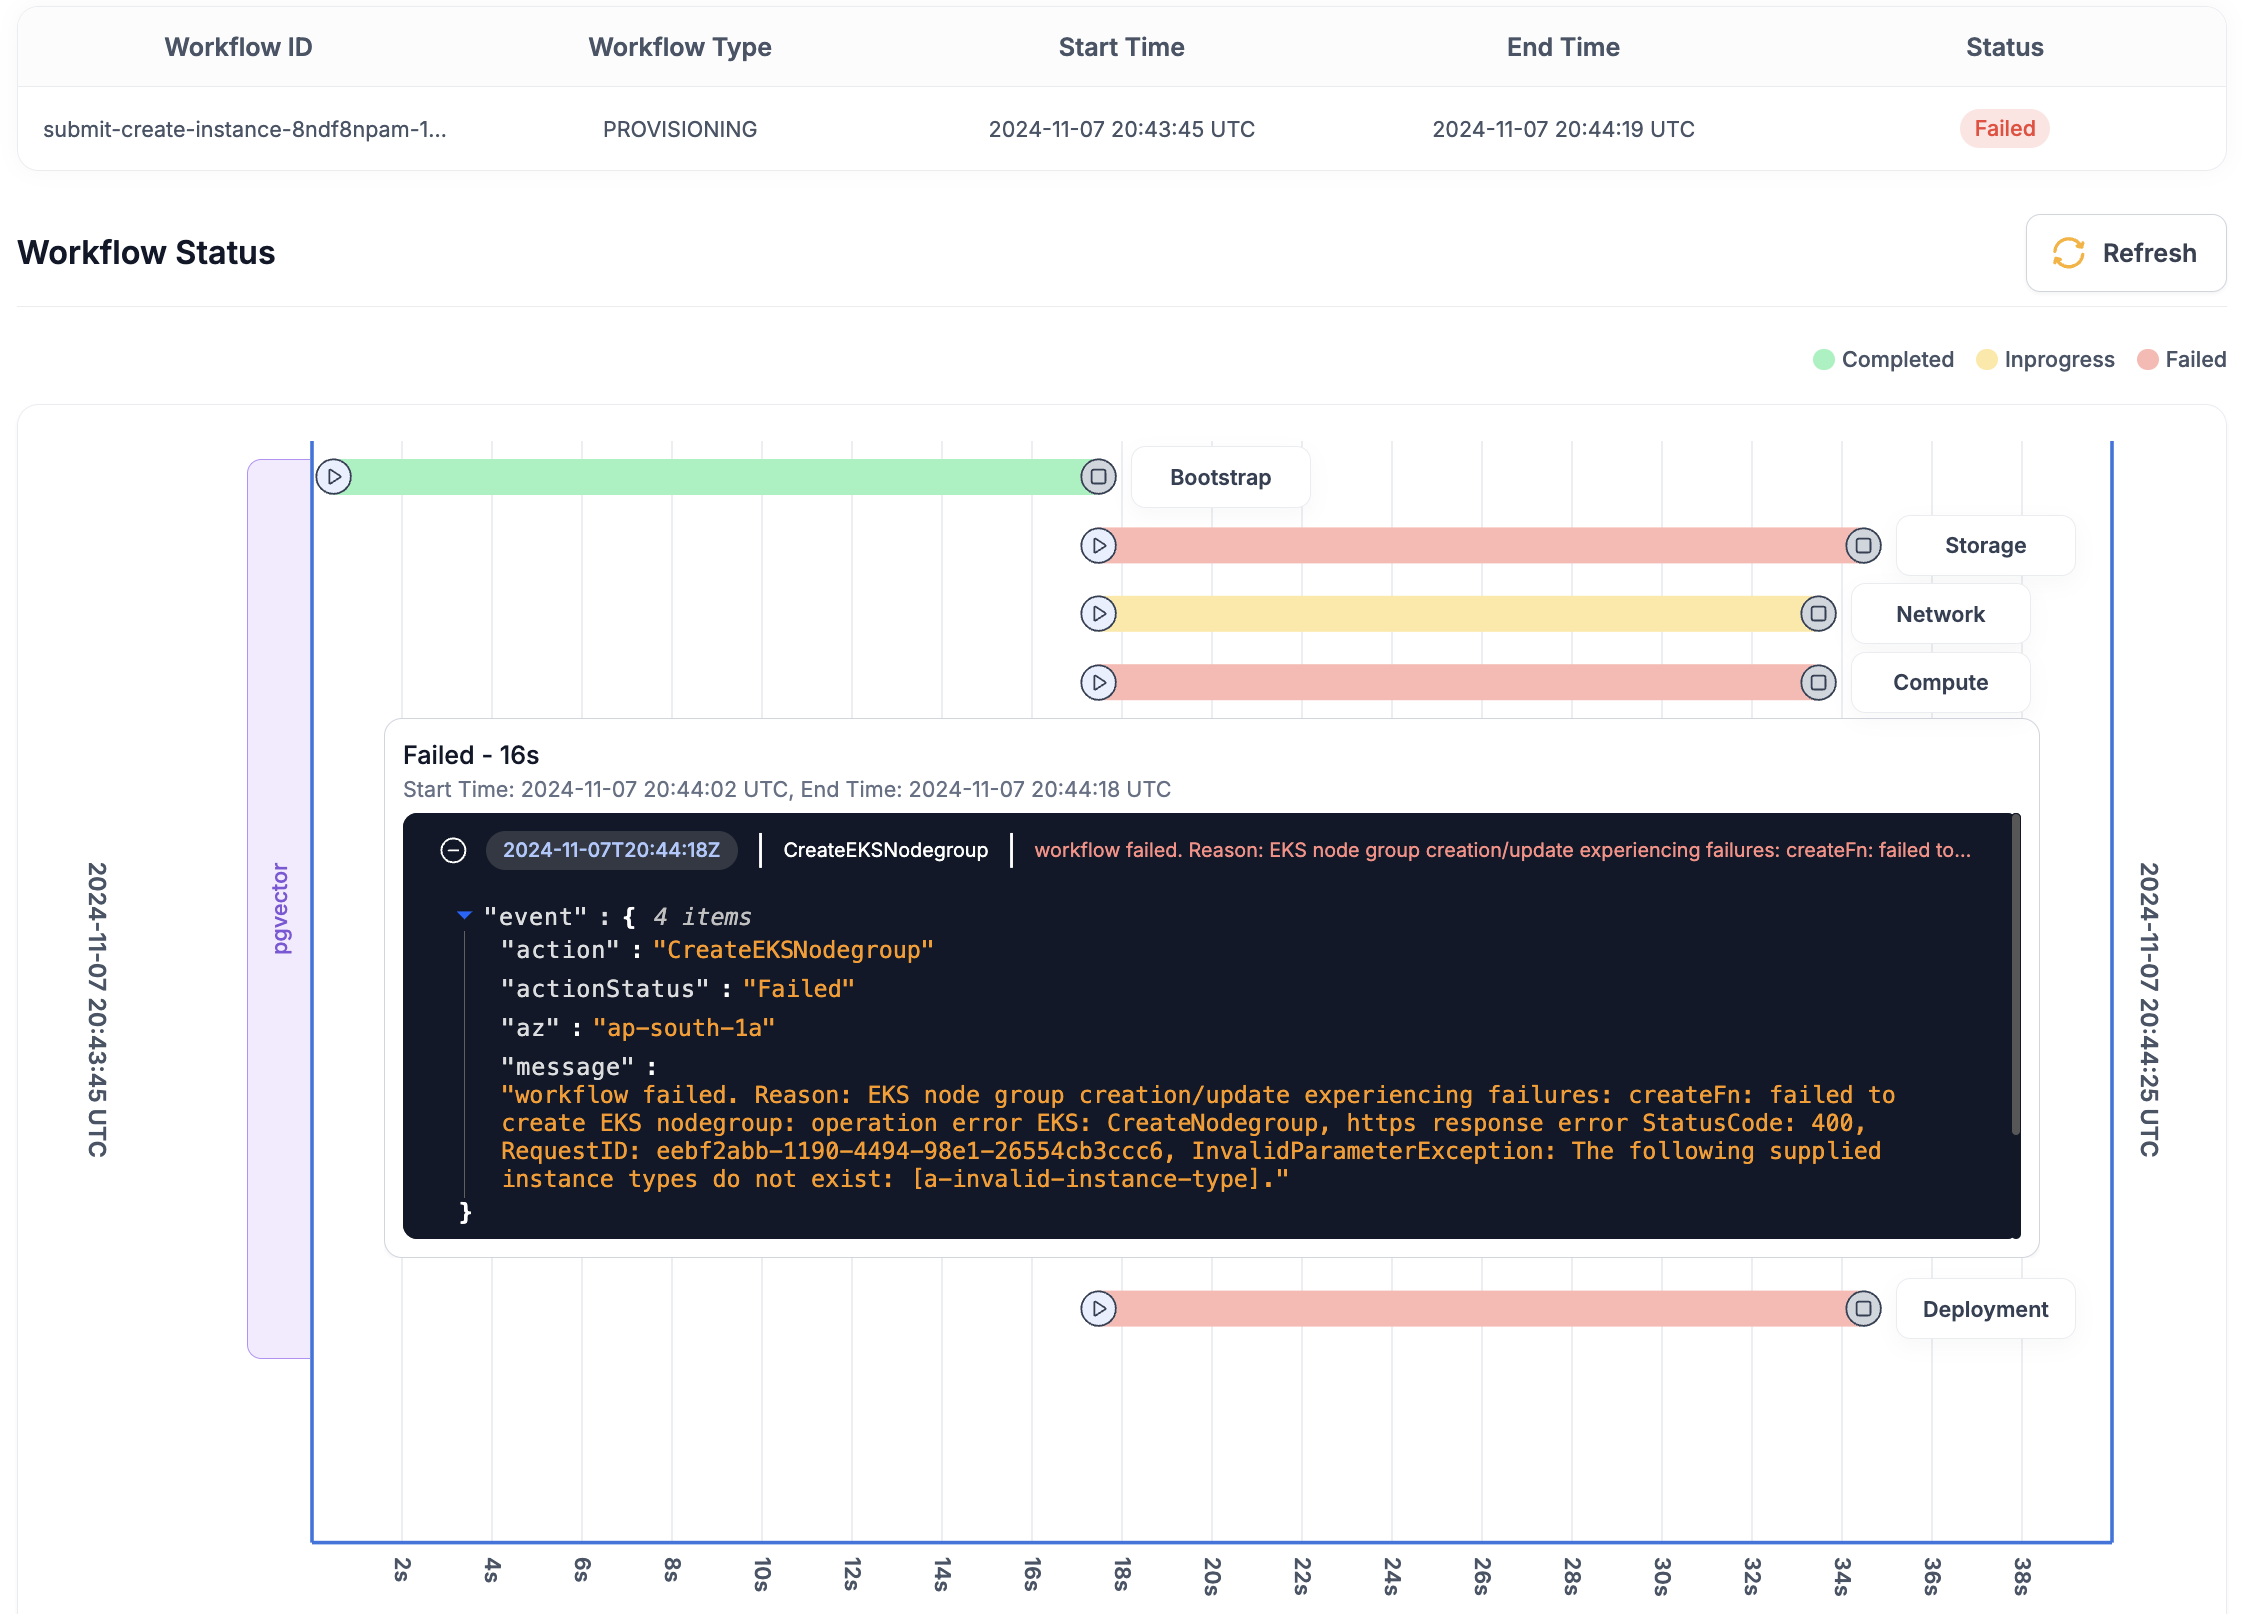
By utilizing Omnistrate's Debug Events, you can streamline issue resolution, improve operational efficiency, and ensure a smoother service experience.
Instance Debug
For most day-to-day Helm, Terraform, Compose, and Operator troubleshooting, start with the instance debug view:
Use it to inspect the instance DAG, select the failing resource, and review resource-specific runtime details. The interactive view has a Resource Details tab for the deployment topology and a Metrics tab for Grafana dashboard metadata when metrics are enabled.
This is the primary place to look for:
- Workflow events for each resource
- Application logs for Compose, Helm, Terraform, and Operator resources when log streams are available
- Metrics dashboard access and published dashboard details when metrics are enabled
- Rendered Helm values and Helm client logs
- Terraform progress, rendered files, output, plan previews, execution logs, and operation history
- Compose deployment API parameters and deployment output parameters
- Operator deployment API parameters, deployment output parameters, and Operator CRD outputs
For non-interactive automation, use JSON output:
If you only need the metrics dashboard details, use:
Resource Debug Coverage
| Resource type | What instance debug shows |
|---|---|
| Compose | App logs, deployment API parameters, deployment output parameters, and workflow events |
| Helm | Helm install/upgrade logs, app logs, rendered chart values, deployment API parameters, deployment output parameters, and workflow events |
| Terraform | Progress, rendered Terraform files, Terraform output, live execution logs, app logs, operation history, plan previews, and workflow events |
| Operator | App logs, deployment API parameters, deployment output parameters, Operator CRD outputs, and workflow events |
Tip
If logs or metrics are not shown, confirm that the relevant integration is enabled for the SaaS Product. Compose-based SaaS Products use x-customer-integrations or x-internal-integrations; Helm, Terraform, and Operator plans use features.CUSTOMER or features.INTERNAL. For configuration details, see Integrations.
Helm Troubleshooting Checklist
For Helm-based SaaS Products, most repeated failures fall into a small set of categories. Start with omnistrate-ctl instance debug <instance-id> and work through the following:
- Confirm the rendered chart values match what you expect.
- Read the Helm client logs for hook failures, timeouts, or Kubernetes API validation errors.
- Review app logs for workload-level startup or readiness failures.
- Check whether
Jobs, hooks,Services, or load balancers are stuck in a pending state. - Look for leftover CRDs, finalizers, or namespaced resources if create or delete workflows keep failing.
- Revisit Helm runtime flags such as
wait,waitForJobs,skipCRDs,upgradeCRDs, andtimeoutNanosif the chart behavior does not match the release lifecycle you need.
For runtime flag details, see Helm Charts Runtime Configuration.
If you changed chart inputs or rendered artifacts, publish a new Plan version instead of repeatedly restarting the same workflow. See Workflows.
Compose Troubleshooting Checklist
For Compose-based SaaS Products, use omnistrate-ctl instance debug <instance-id> to open the Compose resource and work through the following:
- Review app logs for container startup, health check, or dependency errors.
- Confirm deployment API parameters resolved to the expected runtime values.
- Confirm deployment output parameters contain the values other resources or customers expect.
- Check workflow events to identify whether the failure happened during bootstrap, storage, network, compute, deployment, or monitoring.
- Use the Metrics tab or
omnistrate-ctl instance dashboard <instance-id>to verify dashboard access when metrics are enabled.
Operator Troubleshooting Checklist
For Operator-based SaaS Products, use omnistrate-ctl instance debug <instance-id> to open the Operator resource and work through the following:
- Review app logs from the operator-managed workload.
- Confirm deployment API parameters resolved to the expected custom resource inputs.
- Inspect Operator CRD outputs and exported deployment output parameters.
- Check workflow events to separate Omnistrate orchestration errors from operator reconciliation errors.
- Use the Metrics tab or
omnistrate-ctl instance dashboard <instance-id>to verify dashboard access when metrics are enabled.
Terraform Troubleshooting Checklist
For Terraform-based SaaS Products, use omnistrate-ctl instance debug <instance-id> to inspect rendered artifacts, terraform plan output, apply logs, provider configuration, and exported outputs. Work through the following:
- Confirm rendered Terraform files contain the expected system parameters, API parameters, secrets, and dependency outputs.
- Confirm the captured
terraform planmatches the resources you expected to create, update, or delete. - Review apply logs for IAM permissions, quotas, unavailable regions or SKUs, networking inputs, and resource name conflicts.
- Verify provider configuration and credentials, especially for BYOC, control-plane-targeted Terraform, and Nebius authentication.
- Confirm Terraform outputs are available to downstream Helm, Operator, Kustomize, or Terraform resources.
This visibility allows you to diagnose issues without needing direct access to the Terraform state or the execution environment. If a Terraform operation fails, the plan output helps you understand what Terraform attempted, and the apply logs show where it failed.
Tip
When debugging a Terraform failure, start by reviewing the plan output to confirm that the intended changes match your expectations. If the plan looks correct but the apply fails, check the apply logs for cloud provider errors such as quota limits, permission issues, or resource conflicts.
Which surface to trust
Use each surface for a different layer of the problem:
- Workflow view: orchestration context, stage transitions, and the high-level error captured by the workflow
- Instance debug: resource-level logs, metrics metadata, rendered artifacts, parameters, outputs, and operation history
- Live cluster or cloud state: final confirmation of what actually landed
The Workflow UI shows the status of the deployment workflow, while Instance Debug shows the current state of the deployed resources. These views may reflect different stages of the deployment lifecycle. For example, a workflow may time out after resources are successfully created, or a post-deployment validation workflow step may fail even though the resources are healthy. Use Instance Debug to investigate resource-level issues and Workflow Events to identify the workflow execution and step that produced the reported status.
Omnistrate runs terraform plan and terraform apply automatically as part of the workflow. Instance Debug provides the rendered Terraform files and plan preview for review before you investigate apply logs. When Terraform source or inputs change, publish a new Plan version and trigger a fresh workflow; see Restarting a Workflow vs Publishing a New Version for the exact behavior.
For the full Terraform-specific workflow, see Terraform Troubleshooting.